**Cross-validation (CV) is a statistical test procedure based on resampling. It is an essential tool in modern statistics. Resampling refers to repeatedly taking samples from a training dataset and fitting a model to each sample again. This approach allows you to obtain important information about the fitted model.**
Photo by Glenn Carstens-Peters on Unsplash
Resampling methods can be very computationally intensive as the statistical model is applied several times to different subsets of the training dataset. For example, you can use cross-validation to estimate the test error.
With the test error, you can evaluate the performance of a learning method or select the appropriate level of flexibility. The evaluation of the performance of a model is called model assessment. The selection of the level of flexibility for a model is called model selection. [1]
## Basic idea
In reality, a large test dataset to test our statistical model is usually not available. There are several cross-validation methods to address this challenge. The basic idea behind cross-validation is that we do not use the whole dataset to fit a statistical model. We split the dataset into a training dataset and a validation dataset. The validation dataset is usually slightly smaller than the training dataset. The following figure illustrates this.
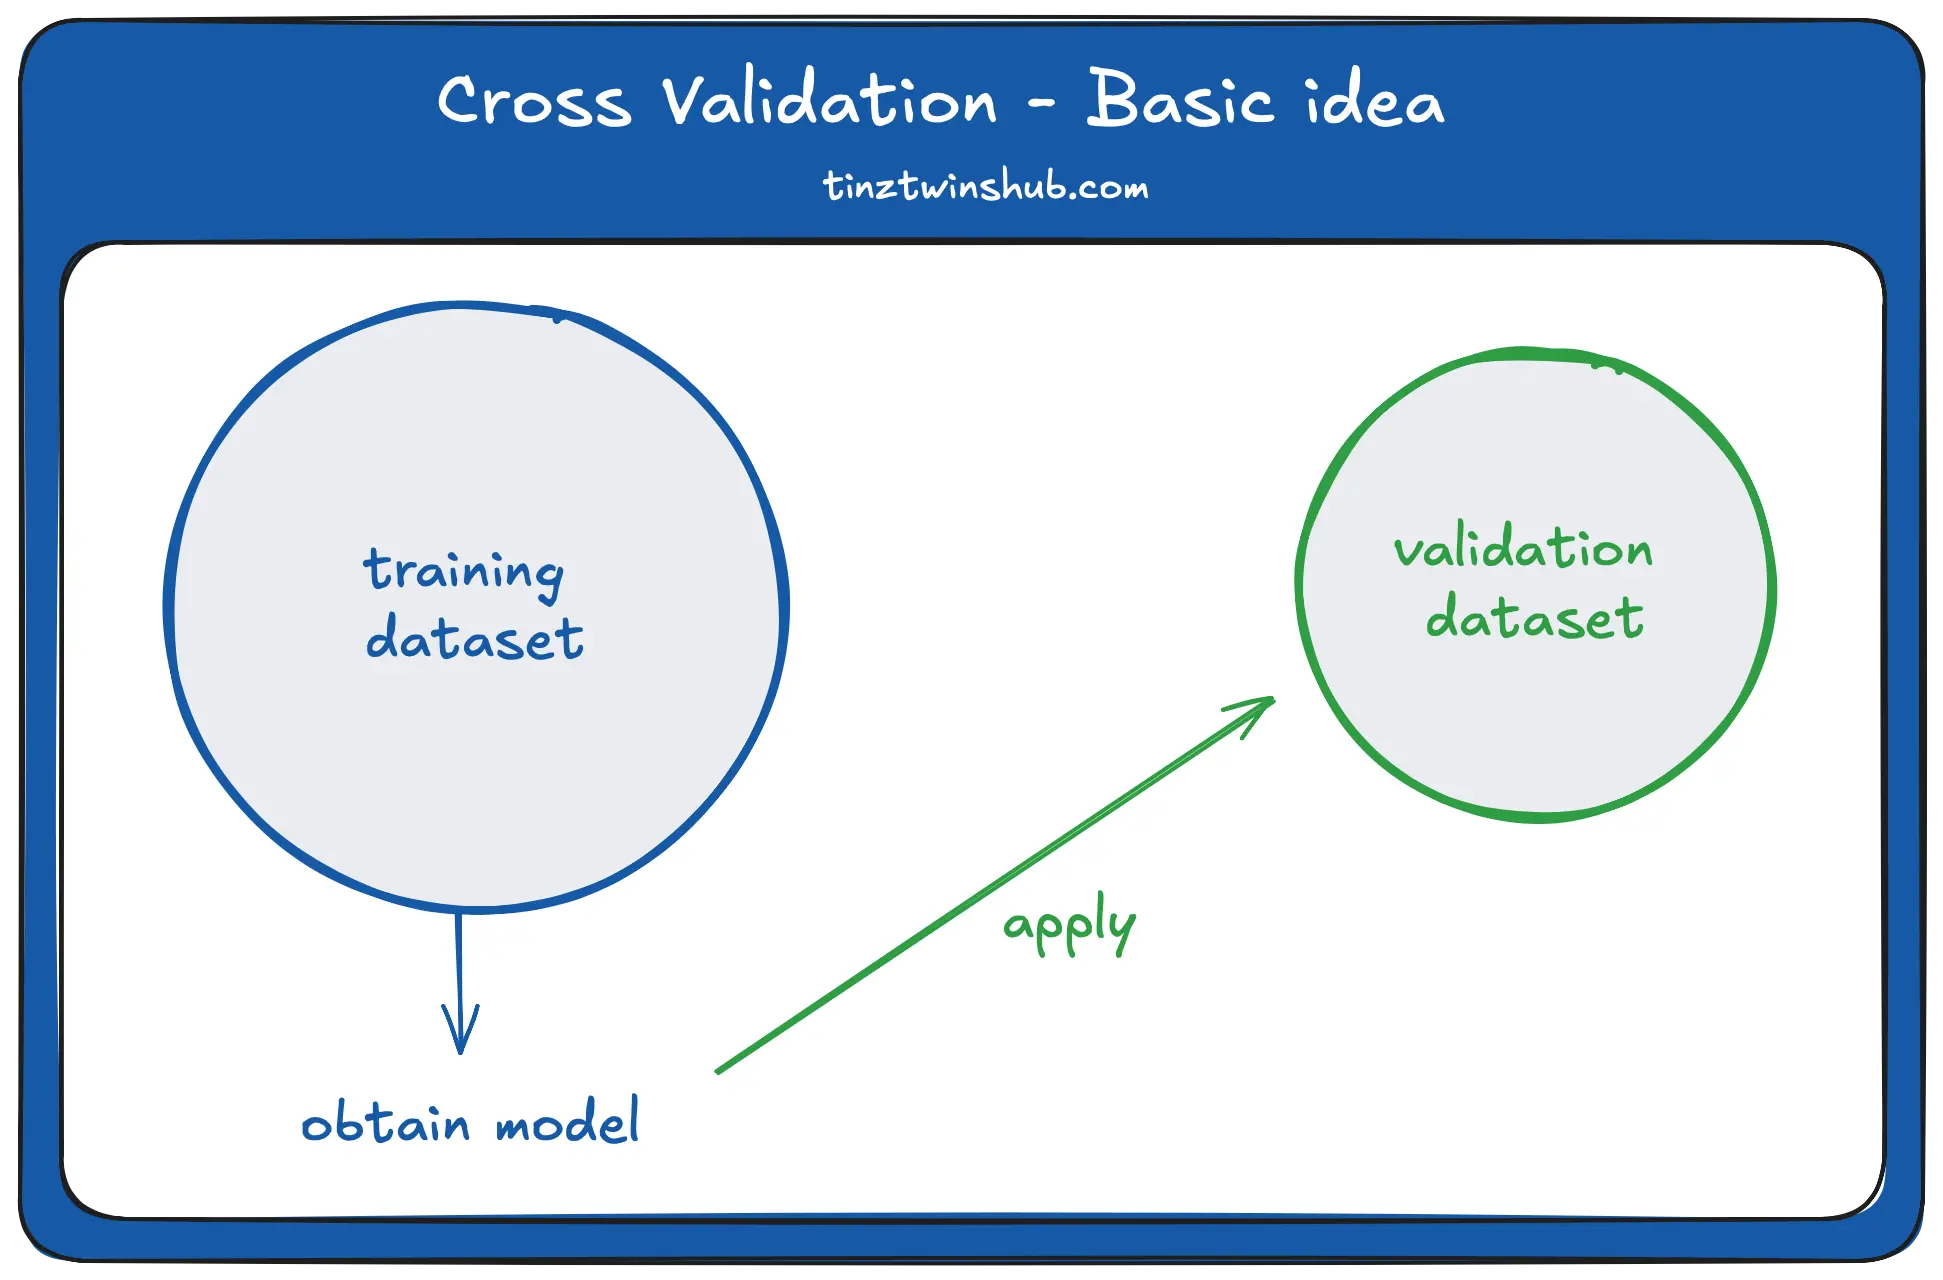
We fit a statistical model with the training dataset. Then we apply the trained model to the validation dataset. The question is: How well does the statistical model work on the test dataset? We can also call it **goodness of fit**.
## Goodness of fit
You can measure the goodness of fit with a prediction using the model. Then you see how well the prediction fits the data. There are three rates:
* **Test error rate**: Error in the prediction of test data
* **Validation error rate**: Estimated test error rate
* **Training error rate**: Error in the prediction of training data
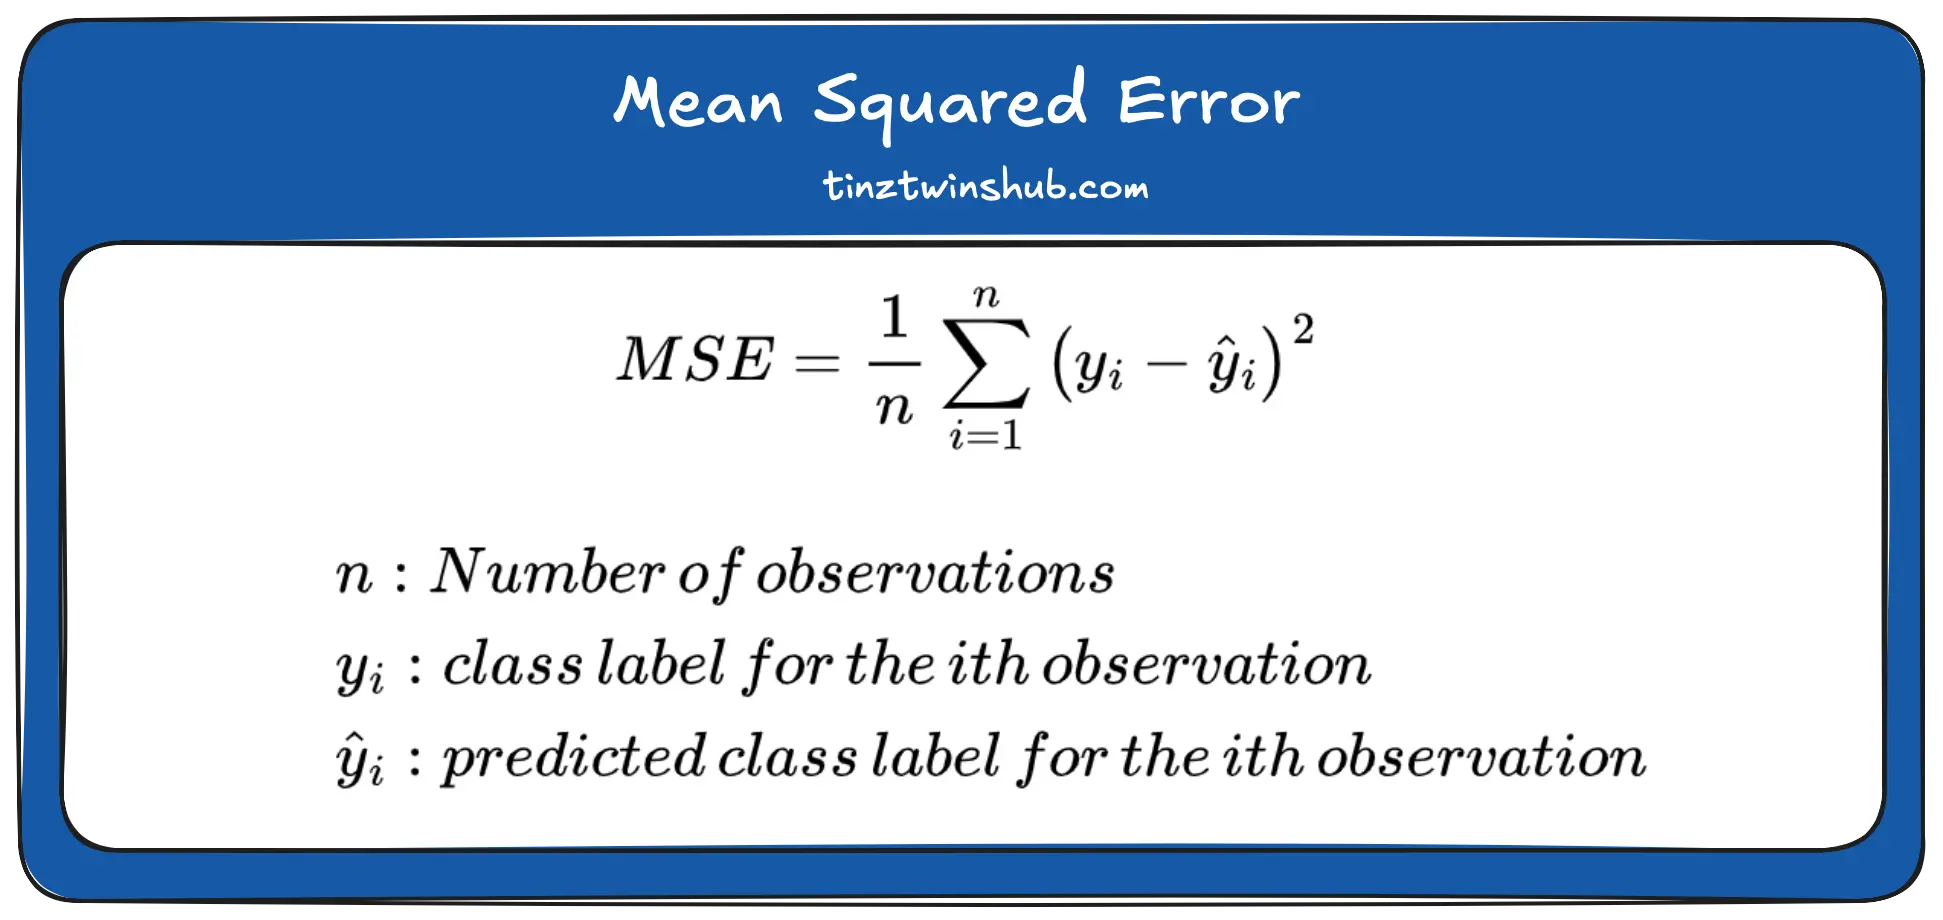
Typically the Mean Squared Error (MSE) is used to calculate these rates.
**Formula MSE:**
## Example dataset
We use in this article the “[California housing dataset](https://inria.github.io/scikit-learn-mooc/python_scripts/datasets_california_housing.html){:target="_blank" rel="noopener"}” (Licensed under [BSD 3 clause](https://joinup.ec.europa.eu/licence/bsd-3-clause-new-or-revised-license){:target="_blank" rel="noopener"}) as an example dataset. The aim is to predict house prices.
### Import dataset
In the first step, we import the data. Look at the following code.
```python
from sklearn import datasets
california_housing = datasets.fetch_california_housing(as_frame=True)
```
### Description of the variables
Now let’s look at the description of the individual variables to understand the factors influencing the house price.
```python
print(california_housing.DESCR)
# Output:
# . _california_housing_dataset:
#
# California Housing dataset
# --------------------------
#
# **Data Set Characteristics:**
#
# :Number of Instances: 20640
#
# :Number of Attributes: 8 numeric, predictive attributes and the target
#
# :Attribute Information:
# - MedInc median income in block group
# - HouseAge median house age in block group
# - AveRooms average number of rooms per household
# - AveBedrms average number of bedrooms per household
# - Population block group population
# - AveOccup average number of household members
# - Latitude block group latitude
# - Longitude block group longitude
```
### Dataset in detail
Now we store the data without the target variable in ***X***.
```python
X = california_housing.data
X.head()
```
**Output:**
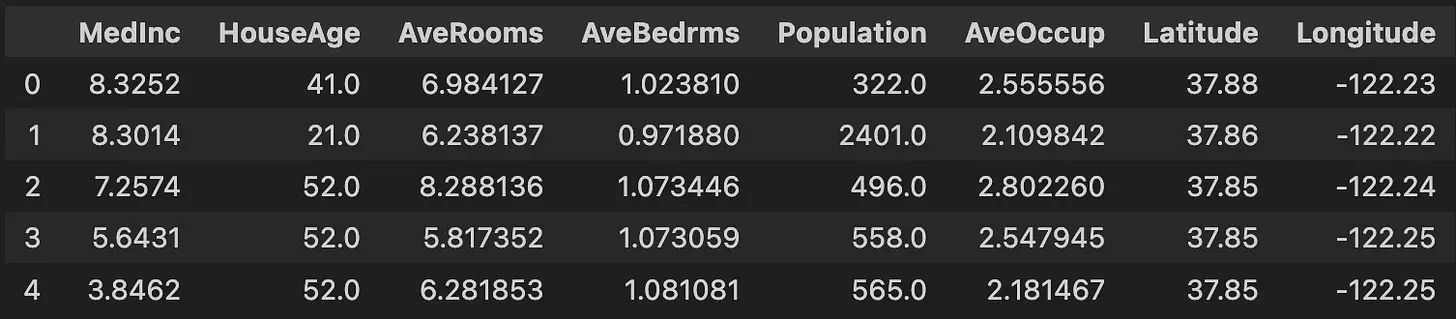
We also store the target variable “***MedHouseVal***” in ***y***. The target variable is the median house value for California districts (in hundreds of thousands of dollars — $100,000).
```python
# target variable
y = california_housing.target
y.head()
# Output:
# 0 4.526
# 1 3.585
# 2 3.521
# 3 3.413
# 4 3.422
# Name: MedHouseVal, dtype: float64
```
## The Validation Set Approach
The validation set approach is the simplest type of cross-validation. We divide the dataset into a training and a validation dataset. We illustrate this with the following figure.
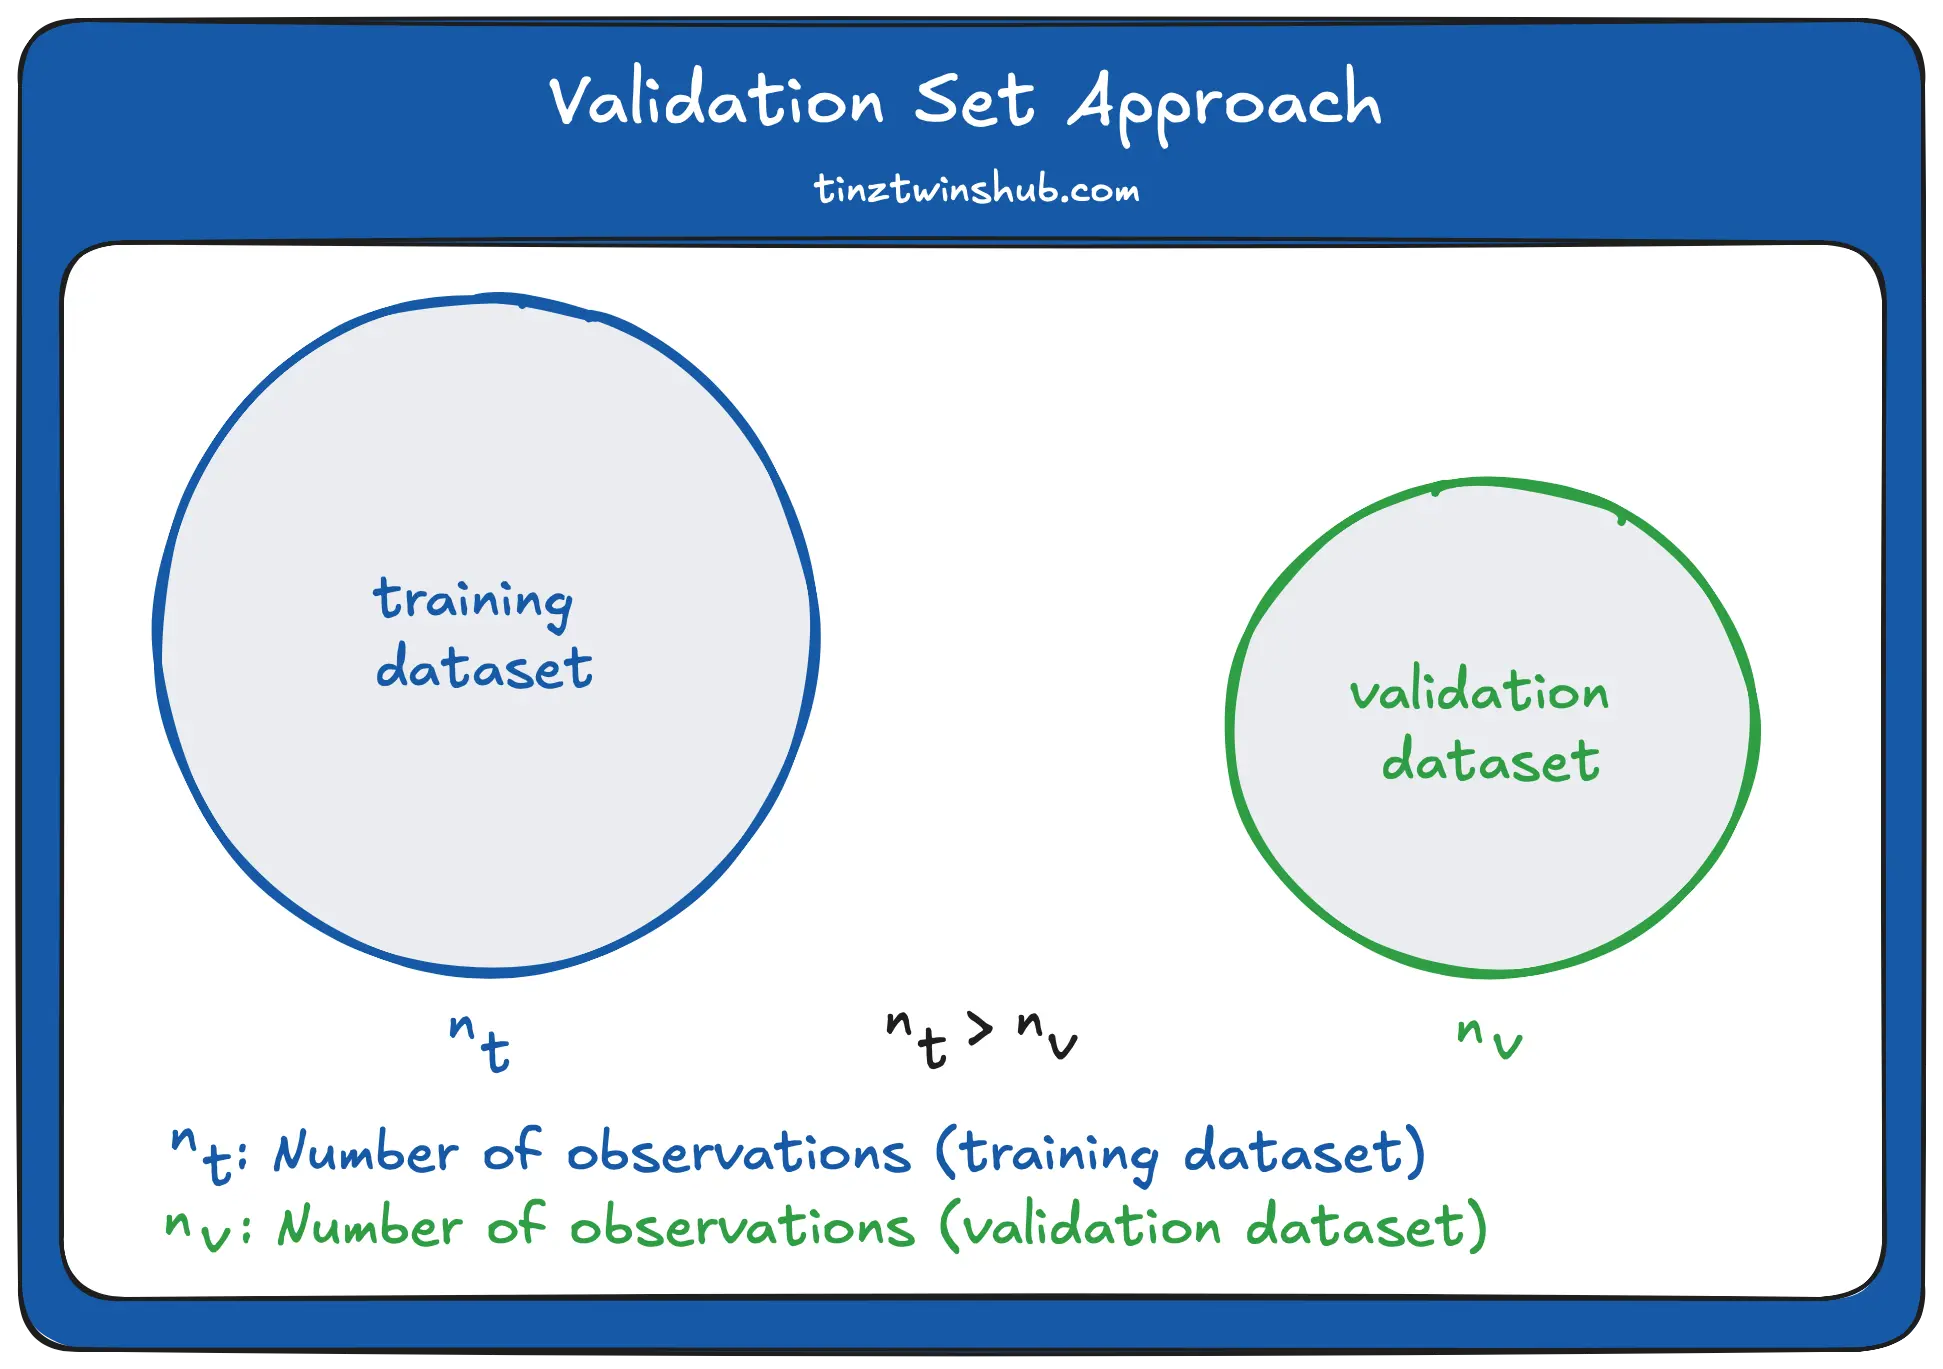
The approach is to fit the model using the training dataset. Then we look at how well the model can predict the data in the validation dataset. The formula for the **validation error rate** is as follows:
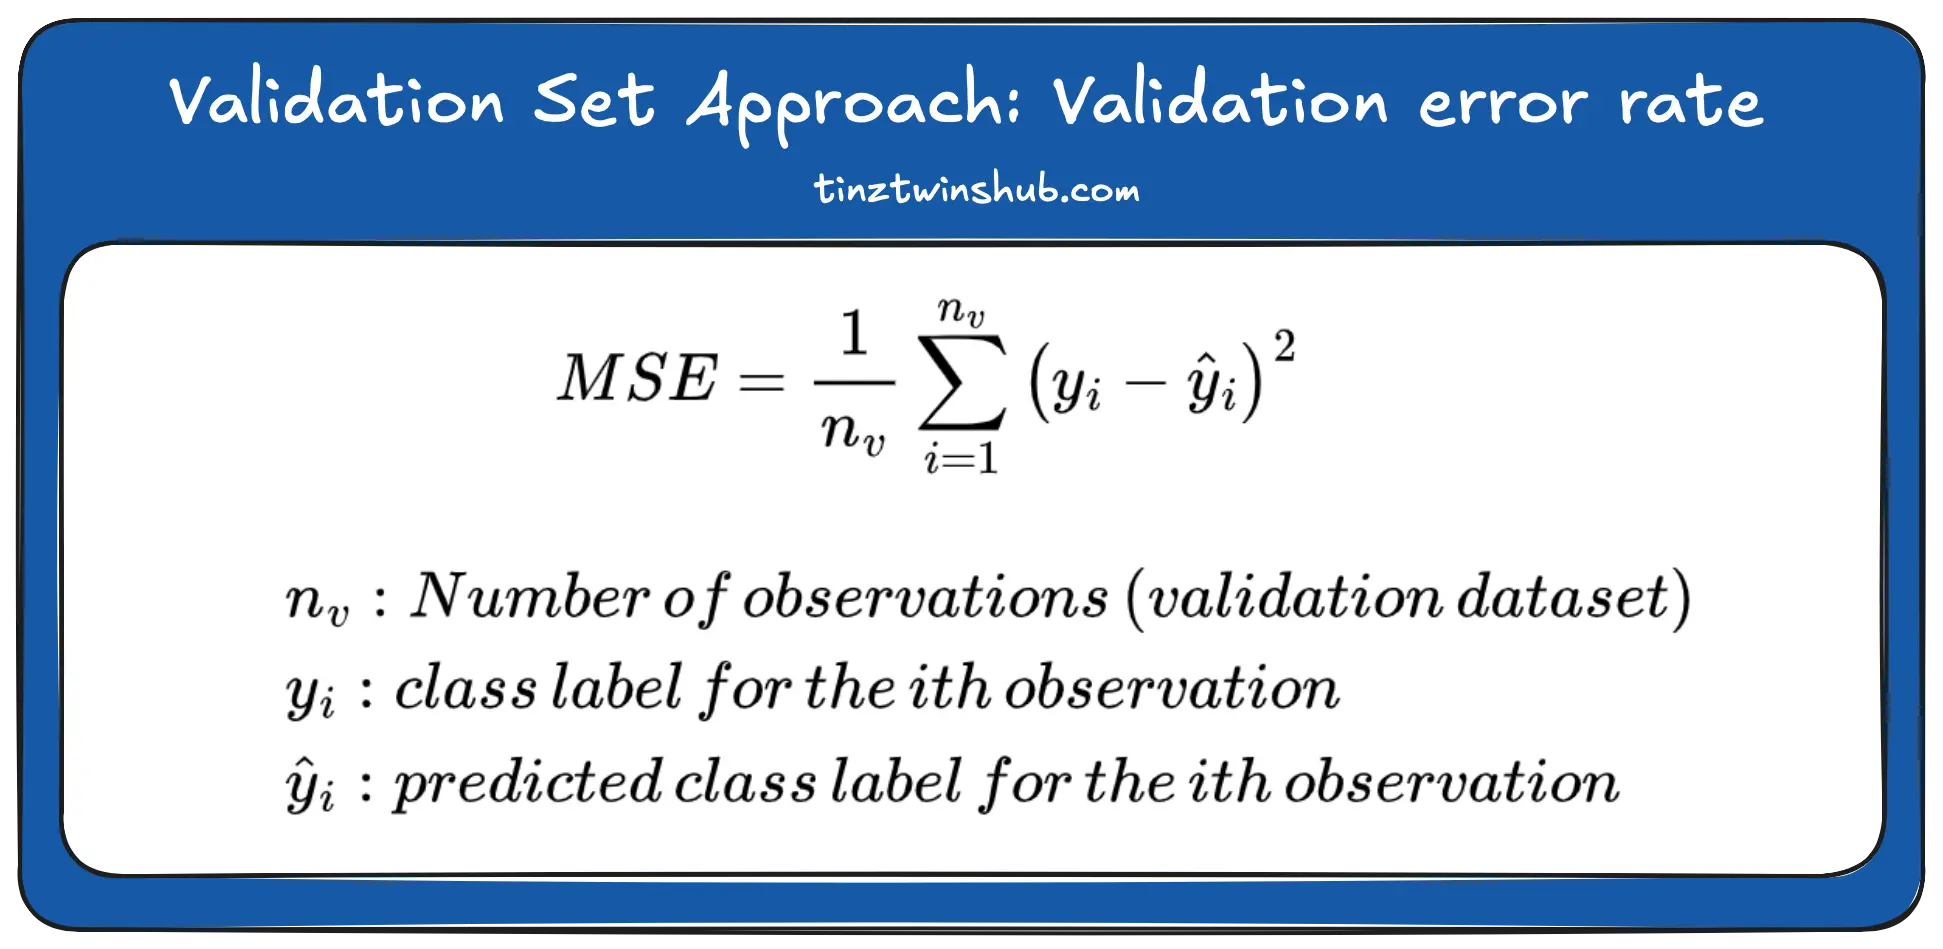
The **validation error rate** provides an estimation of the **test error rate**.
### Advantages
* Very simple strategy: Quick to execute
### Disadvantages
* Strong dependence on distribution: There are often different properties in the training dataset and validation dataset.
* Fit the model only on the training dataset
### Code Example: Validation Set Approach
Now we show you how to use the validation set approach with Python. As an example, we use a simple linear regression. We calculate the validation error rate and perform a runtime measurement.
```python
from sklearn.model_selection import train_test_split
from sklearn.metrics import mean_squared_error
from sklearn.linear_model import LinearRegression
from time import perf_counter
start = perf_counter()
X_train, X_val, y_train, y_val = train_test_split(X, y, test_size=0.2, random_state=42)
linear_regression = LinearRegression()
linear_regression.fit(X_train, y_train)
y_pred = linear_regression.predict(X_val)
val_error_rate = mean_squared_error(y_val, y_pred)
print(perf_counter()-start)
# Output:
# 0.018002947996137664 s
print(val_error_rate)
# Output:
# 0.5558915986952442
```
We use the `train_test_split()` function from the [sklearn Python package](https://scikit-learn.org/stable/){:target="_blank" rel="noopener"} to split the dataset into a training and validation dataset. Then we fit a linear regression model with the training data. We use the trained model to predict the validation data. Then we calculate the validation error rate using the formula presented above. The runtime is **approx. 18 ms** and the validation error rate is **approx. 0.56**.
## Leave-One-Out Cross-Validation (LOOCV)
Like the validation set approach, the LOOCV approach splits the dataset into two parts. In LOOCV, we use a single observation as the validation dataset (validation data point), and the rest belong to the training dataset. Each observation is the validation data point exactly once. The following figure illustrates the procedure.
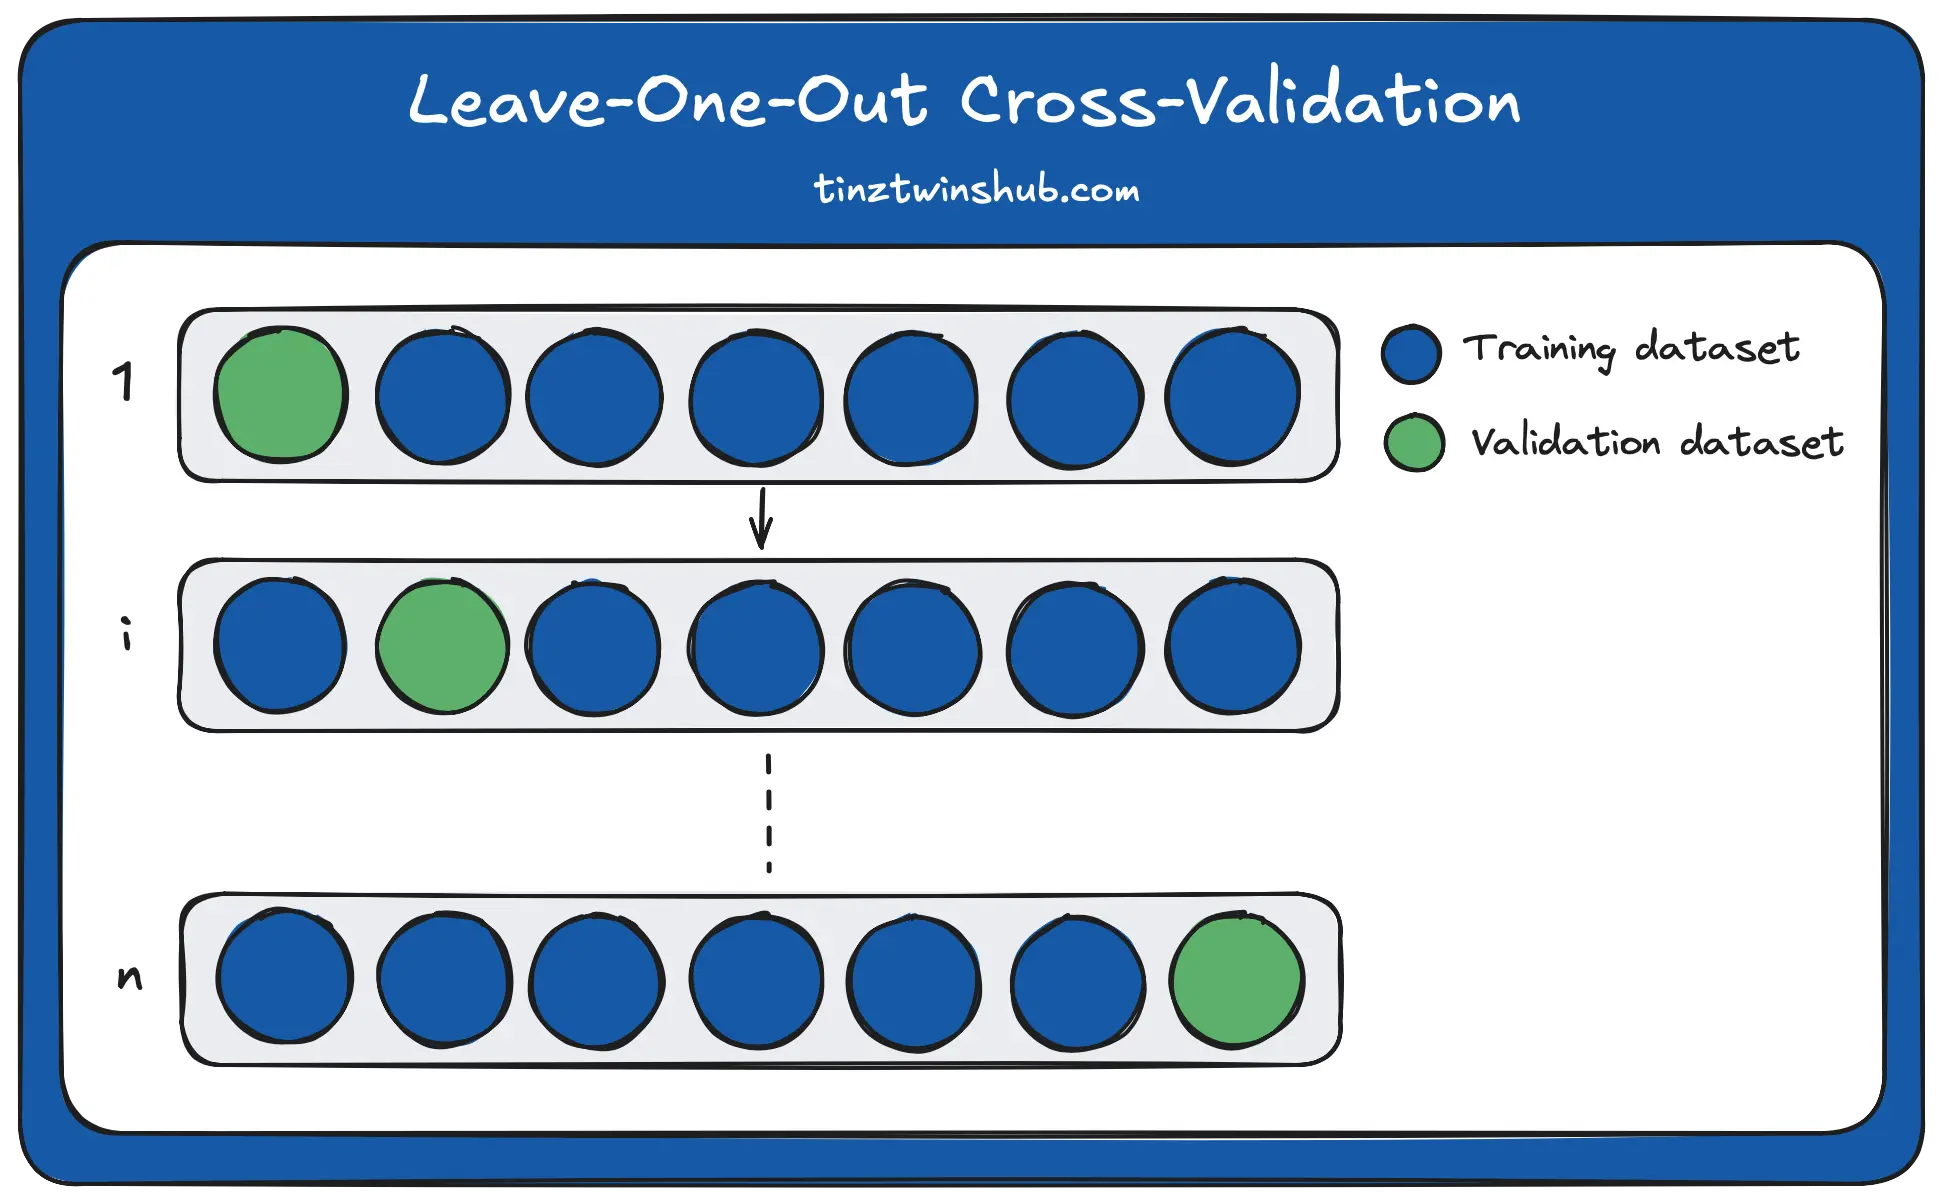
We perform the fitting of the model and the prediction of a validation data point a total of n times. The calculation is as follows:
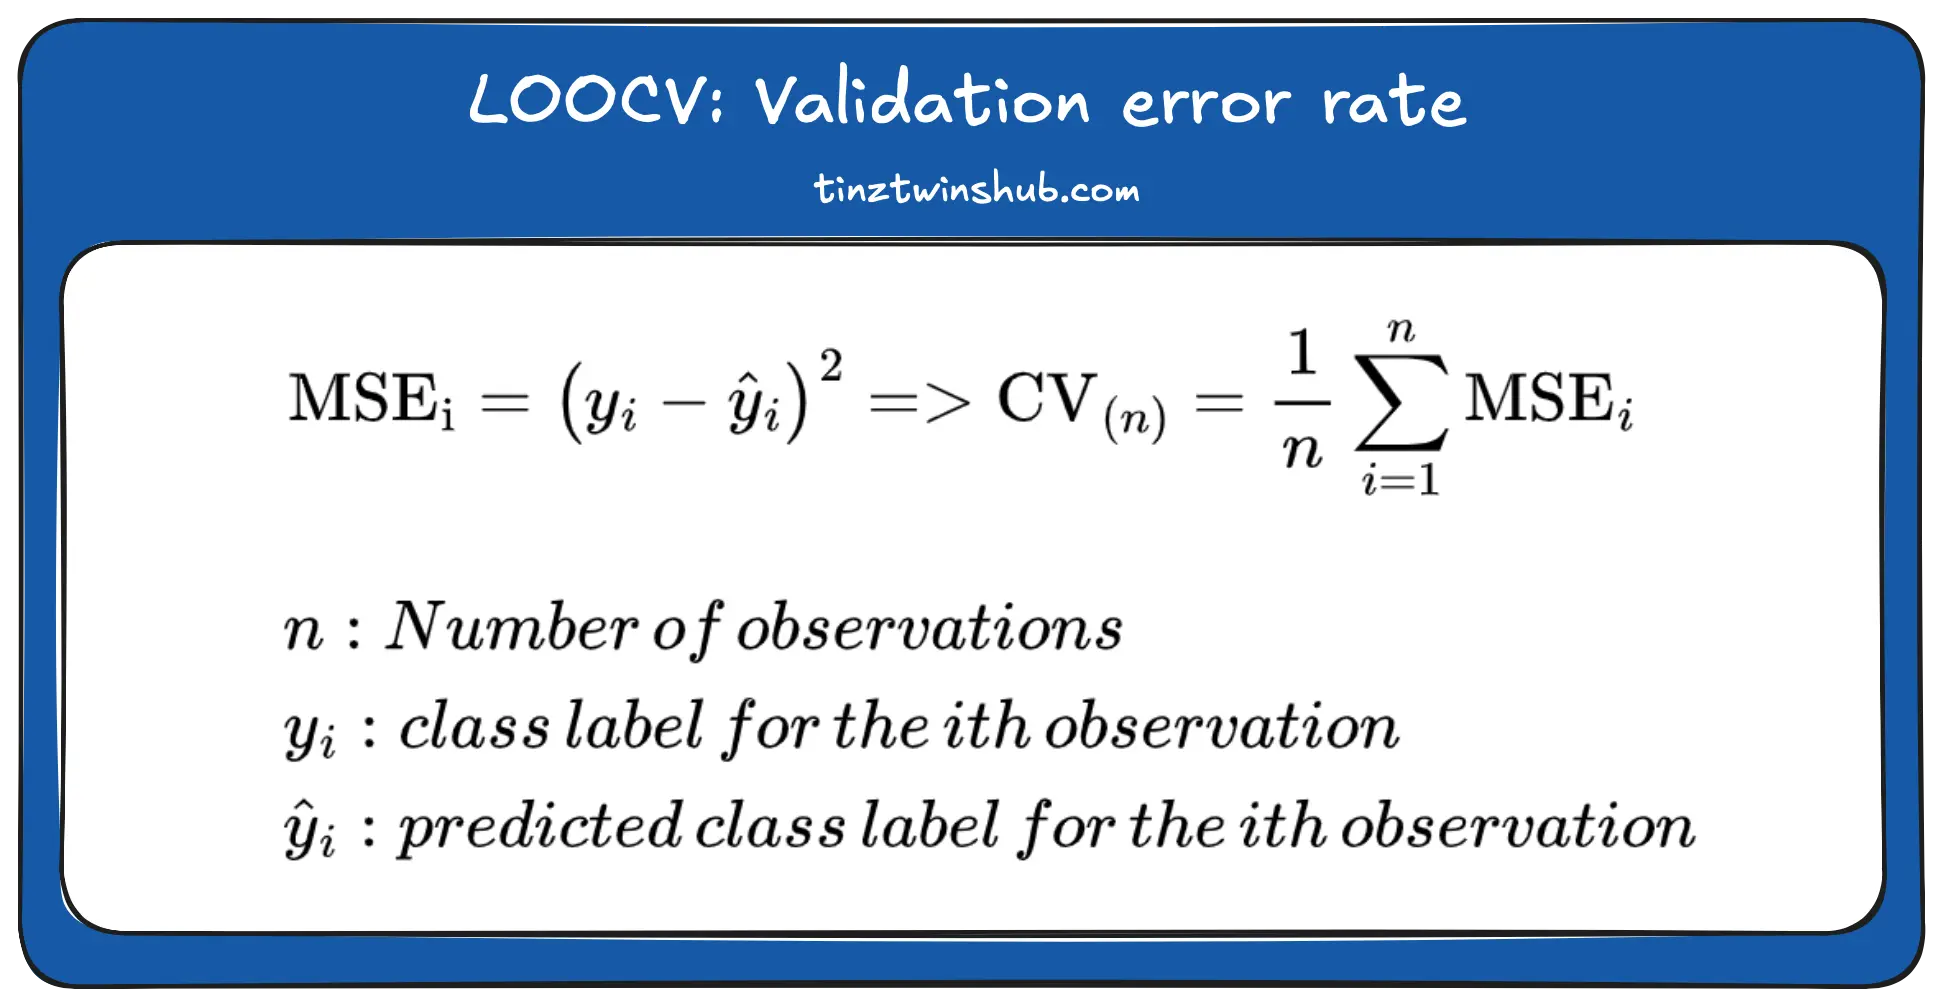
We calculate the MSE for every i-th execution. Then we can calculate the average validation MSE.
### Advantages
* We use the whole dataset for the model training. This approach does not overestimate the test error rate as much as the validation set approach.
* The split of the dataset is schematic. Each data point is a validation data point.
### Disadvantages
* High effort: We have to fit the model n times.
### Code Example: LOOCV
We again use a simple regression. In LOOCV, each data point is a validation data point once, so we perform a model fit for each iteration. We use the function `LeaveOneOut()` from the [sklearn Python package](https://scikit-learn.org/stable/){:target="_blank" rel="noopener"}. In addition, we calculate the validation error rate again and measure the runtime.
```python
from sklearn.model_selection import LeaveOneOut
from sklearn.metrics import mean_squared_error
from statistics import mean
from sklearn.linear_model import LinearRegression
from time import perf_counter
start = perf_counter()
loo = LeaveOneOut()
linear_regression = LinearRegression()
mse_i_list = []
for train, val in loo.split(X):
X_train, X_val, y_train, y_val = X.loc[train], X.loc[val], y[train], y[val]
linear_regression.fit(X_train, y_train)
y_pred = linear_regression.predict(X_val)
mse_i = mean_squared_error(y_val, y_pred)
mse_i_list.append(mse_i)
val_error_rate = mean(mse_i_list)
print(perf_counter()-start)
# Output:
# 204.986410274003 s
print(val_error_rate)
# Output:
# 0.528246204371246
```
We perform the calculation of the `mse_i` for every i-th iteration. We store the results in the list `mse_i_list`. After n iterations, we calculate the validation error rate by averaging the values of the list. The validation error rate is **approx. 0.53**. The LOOCV method has a long runtime (**approx. 204.99 s**). We could expect this because we run the model fitting n times. The validation error rate is lower than with the validation set approach.
## K-Fold Cross-Validation (k-fold CV)
This approach is a compromise between the validation set approach and the LOOCV. This approach randomly divides the set of observations into k groups (folds) of approximately equal size. The following figure illustrates this.
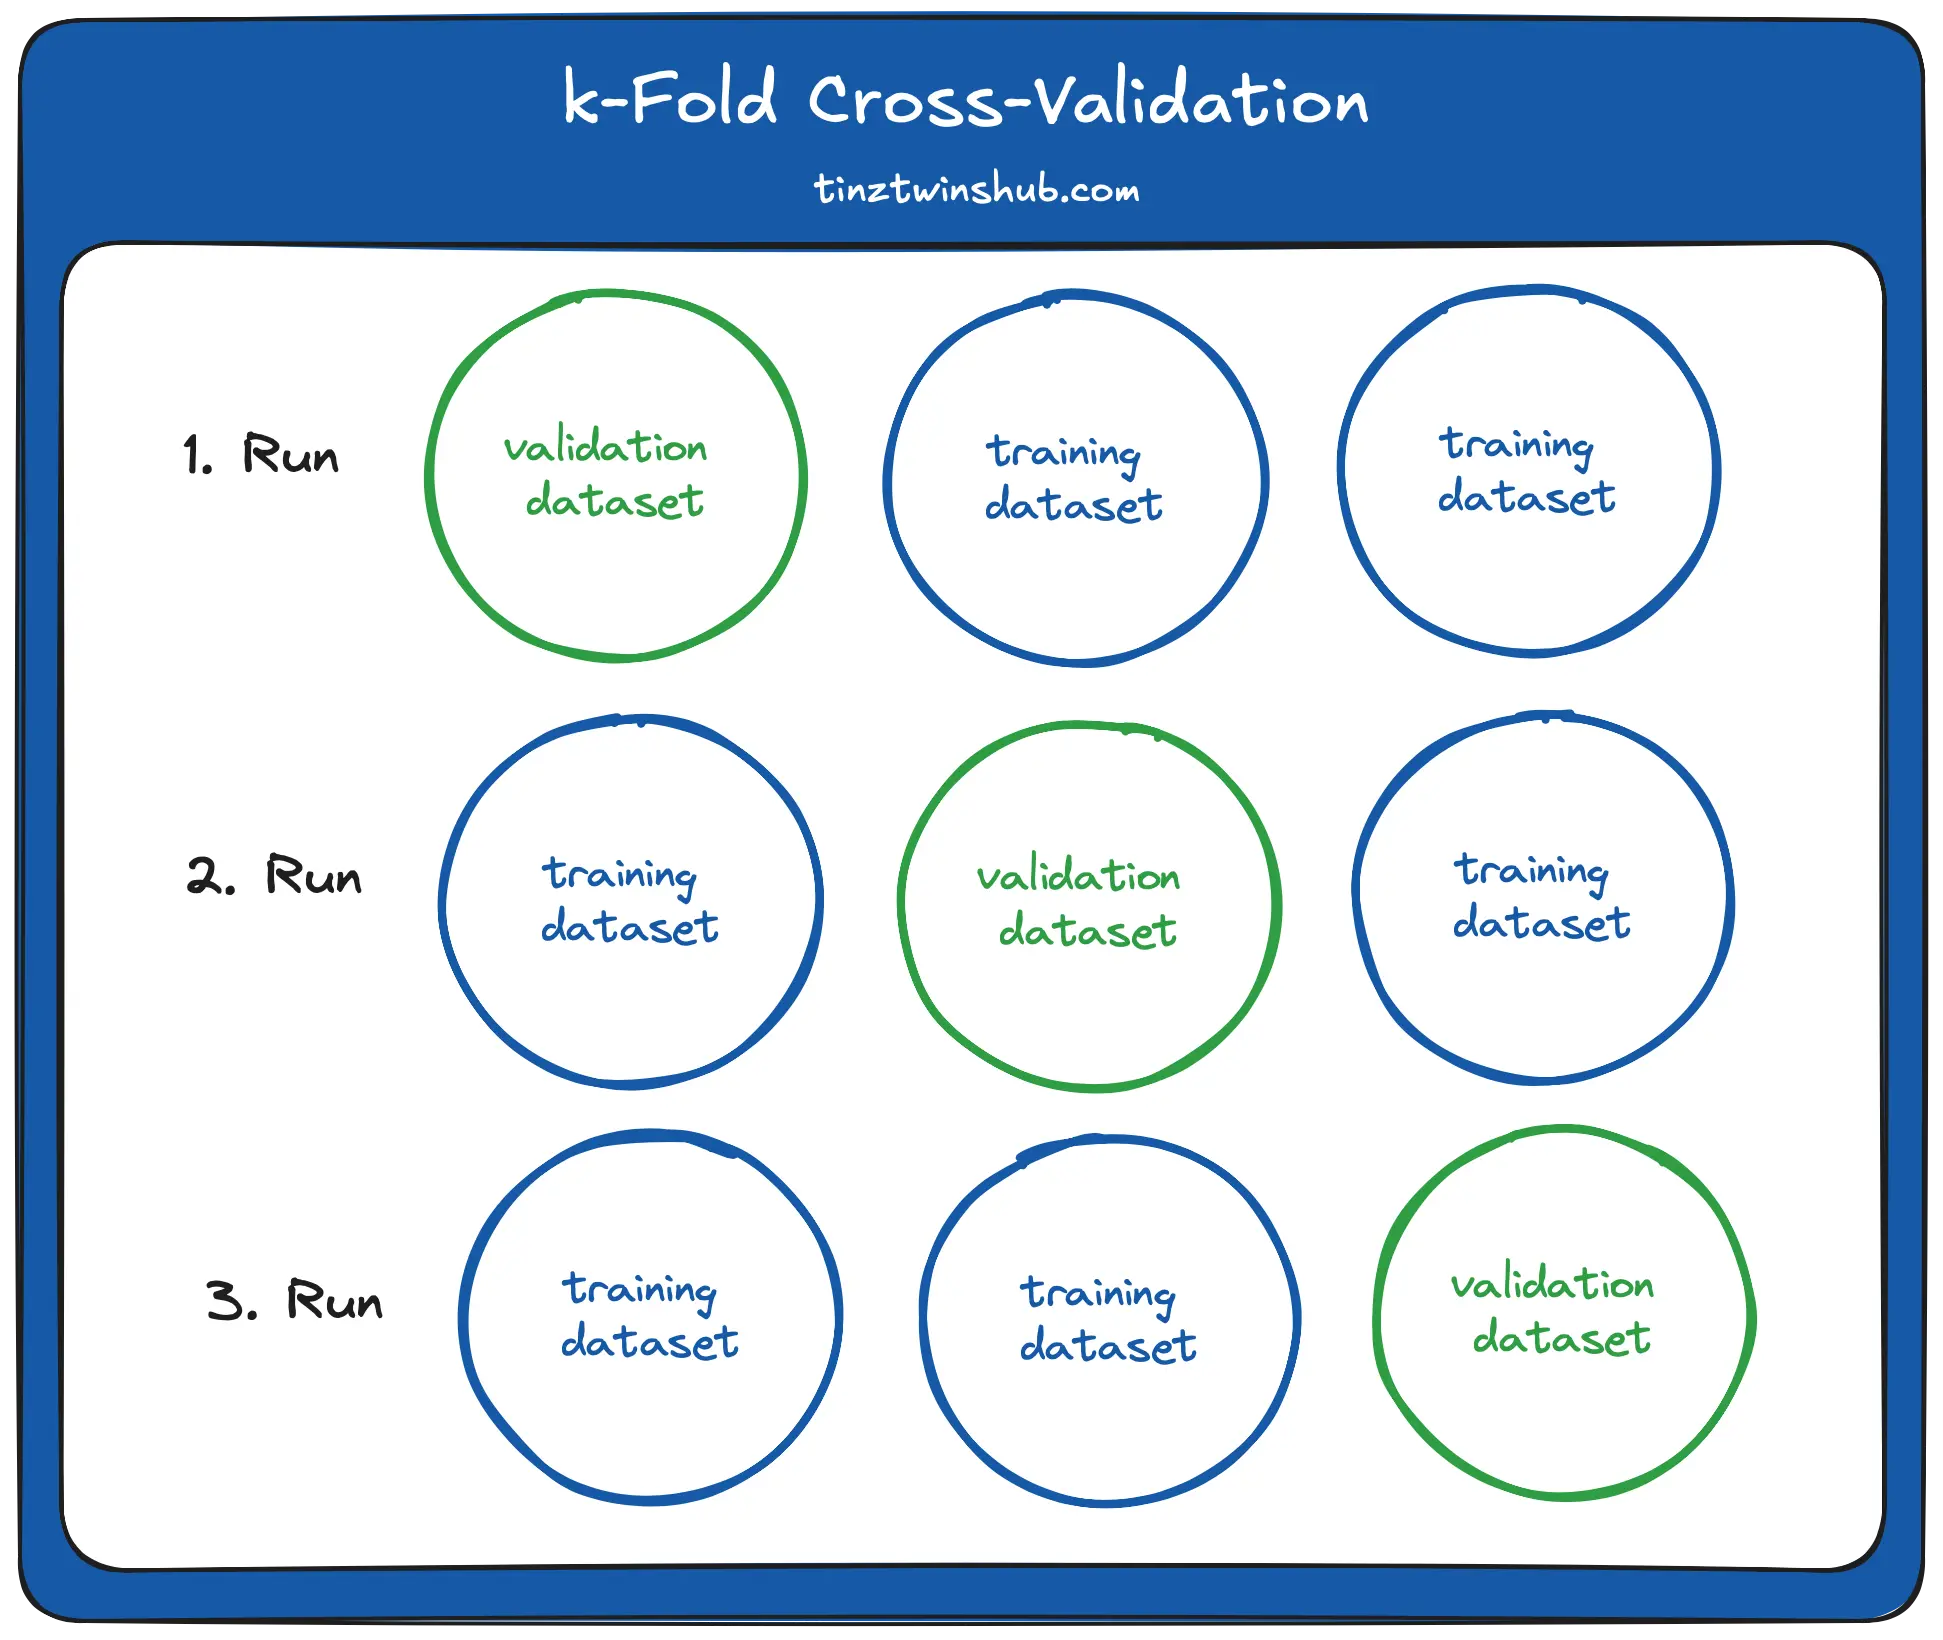
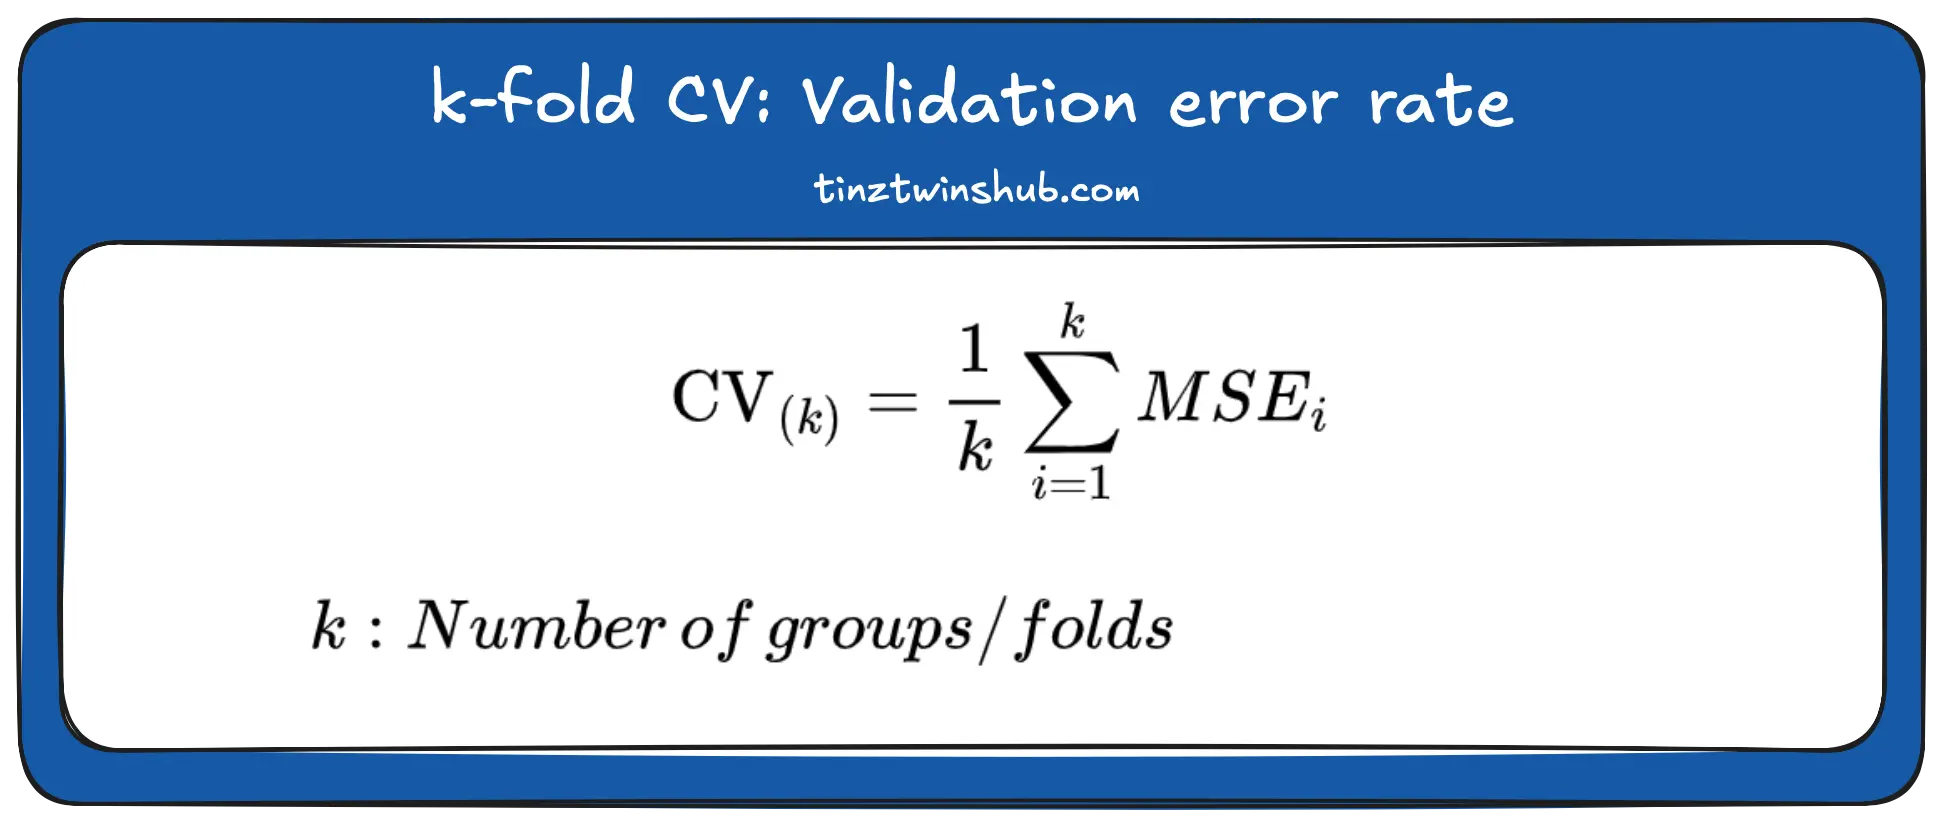
The figure shows a 3-fold cross-validation. In the first run, the first group is the validation dataset, and the other groups are the training dataset. In the second run, the second group is the validation dataset. On the third run, the third group is the validation dataset. This procedure leads to k estimations of the test error, MSE\_1 , MSE\_2 , . . . , MSE\_k . We calculate the k-fold CV estimation by averaging these values:
In practice, we often perform k-fold CV using k = 5 or k = 10.
### Advantages
* Less biased model than other methods
* It’s one of the best methods if only limited input data is available.
### Disadvantages
* We have to fit k times. However, we can accept this disadvantage to estimate the test error rate as accurately as possible.
### Code Example: k-fold CV
We again perform a simple linear regression. But now, we divide our dataset into ten groups. So there are ten iterations. Each group is once the validation dataset. We use `KFold` from the `sklearn.model_selection` module for this. We measure the runtime again and calculate the validation error rate.
```python
from sklearn.model_selection import KFold
from sklearn.metrics import mean_squared_error
from statistics import mean
from sklearn.linear_model import LinearRegression
from time import perf_counter
start = perf_counter()
kf = KFold(n_splits=10)
linear_regression = LinearRegression()
mse_i_list = []
for train, val in kf.split(X):
X_train, X_val, y_train, y_val = X.loc[train], X.loc[val], y[train], y[val]
linear_regression.fit(X_train, y_train)
y_pred = linear_regression.predict(X_val)
mse_i = mean_squared_error(y_val, y_pred)
mse_i_list.append(mse_i)
val_error_rate = mean(mse_i_list)
print(perf_counter()-start)
# Output:
# 0.19677724000939634 s
print(val_error_rate)
# Output:
# 0.5509524296956597
```
For every i-th iteration, we calculate the `mse_i` and store it in the list `mse_i_list`. Then we calculate the validation error rate by averaging the values of the list. We get a validation error rate of **approx. 0.55**. We also recognize that the k-fold CV has a much shorter running time than the LOOCV (**approx. 19.68**).
## Conclusion
Cross-validation is a tool for model selection and performance estimation. It enables a robust and reliable evaluation of machine learning models.
**Lessons Learned:**
* **The Validation Set Approach:** You divide the dataset into a training and a validation dataset. With a small dataset, this method has the disadvantage that the training data may not contain important information.
* **Leave-One-Out Cross-Validation:** In LOOCV, a single observation is used as the validation data point, and the rest belong to the training dataset. This approach provides the best estimation for the test error rate. But it’s very computationally intensive.
* **K-Fold Cross-Validation:** This approach randomly divides the dataset into k groups of equal size. In practice, you usually use k = 5 or k = 10. This number of groups leads to sufficiently good results.
Thanks so much for reading. **Have a great day!**
## References
[1] Gareth, J., Daniela, W., Trevor, H. and Robert, T., 2013. An introduction to statistical learning: with applications in R. Springer.
💡 Do you enjoy our content and want to read super-detailed guides about AI Engineering? If so, be sure to check out our premium offer!