**R is widely used in business and science as a data analysis tool. The programming language is an essential tool for data-driven tasks. For many Statisticians and Data Scientists, R is the first choice for statistical questions.**
Photo by Mohammad Rahmani on Unsplash
Data Scientists often work with large amounts of data and complex statistical problems. Memory and runtime play a central role here. You need to write efficient code to achieve maximum performance. In this article, we present tips that you can use directly in your next R project.
## Use code profiling
Data Scientists often want to optimize their code to make it faster. In some cases, you will trust your intuition and try something out. This approach has the disadvantage that you probably optimize the wrong parts of your code. So you waste time and effort. You can only optimize your code if you know where your code is slow. The solution is **code profiling**. Code profiling helps you find slow code parts!
[Rprof()](https://www.rdocumentation.org/packages/utils/versions/3.6.2/topics/Rprof){:target="_blank" rel="noopener"} is a built-in tool for code profiling. Unfortunately, Rprof() is not very user-friendly, so we do not recommend its direct use. We recommend the [profvis](http://rstudio.github.io/profvis/){:target="_blank" rel="noopener"} package. Profvis allows the visualization of the code profiling data from Rprof(). You can install the package via the R console with the following command:
```r
install.packages("profvis")
```
In the next step, we do code profiling using an example.
```r
library("profvis")
profvis({
y <- 0
for (i in 1:10000) {
y <- c(y,i)
}
})
```
If you run this code in your [RStudio](https://posit.co/downloads/){:target="_blank" rel="noopener"}, then you will get the following output.
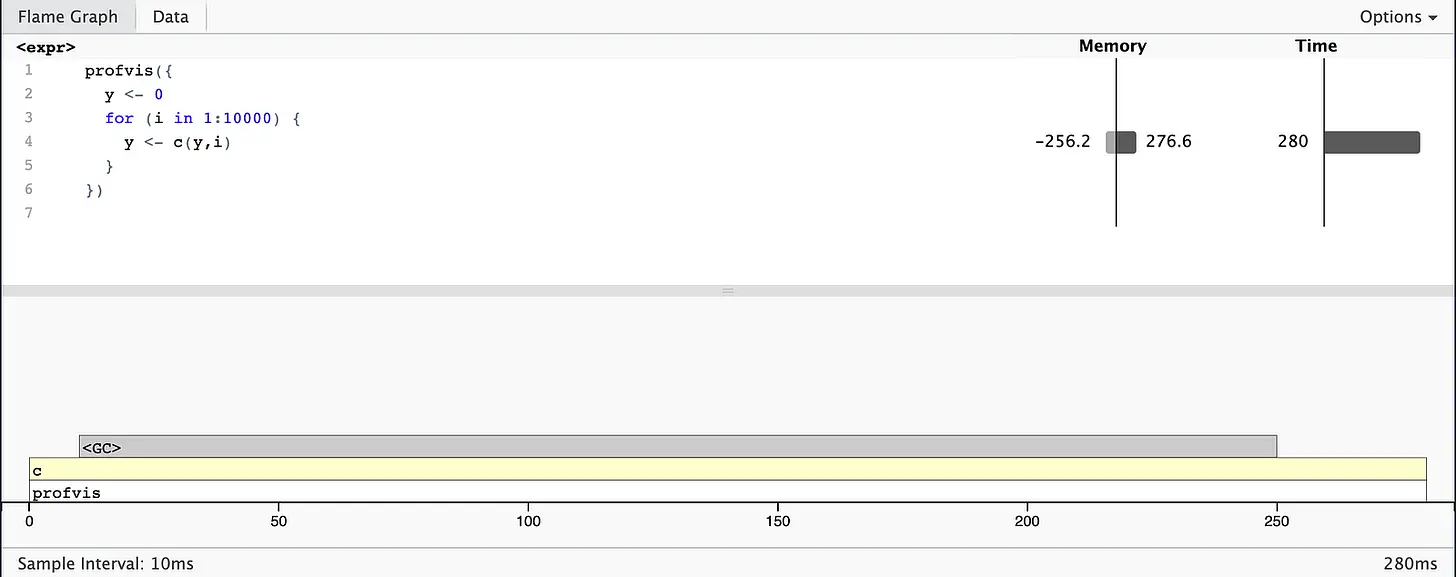
At the top, you can see your R code with bar graphs for memory and runtime for each line of code. This display gives you an overview of possible problems in your code but does not help you to identify the exact cause. In the memory column, you can see how much memory (in MB) has been allocated (the bar on the right) and released (the bar on the left) for each call. The time column shows the runtime (in ms) for each line. For example, you can see that line 4 takes 280 ms.
At the bottom, you can see the ***Flame Graph*** with the full called stack. This graph gives you an overview of the whole sequence of calls. You can move the mouse pointer over individual calls to get more information. It is also noticeable that the garbage collector (<GC>) takes a lot of time. But why? In the memory column, you can see in line 4 that there is an increased memory requirement. A lot of memory is allocated and released in line 4. Each iteration creates another copy of `y`, resulting in increased memory usage. **Please avoid such copy-modify tasks!**
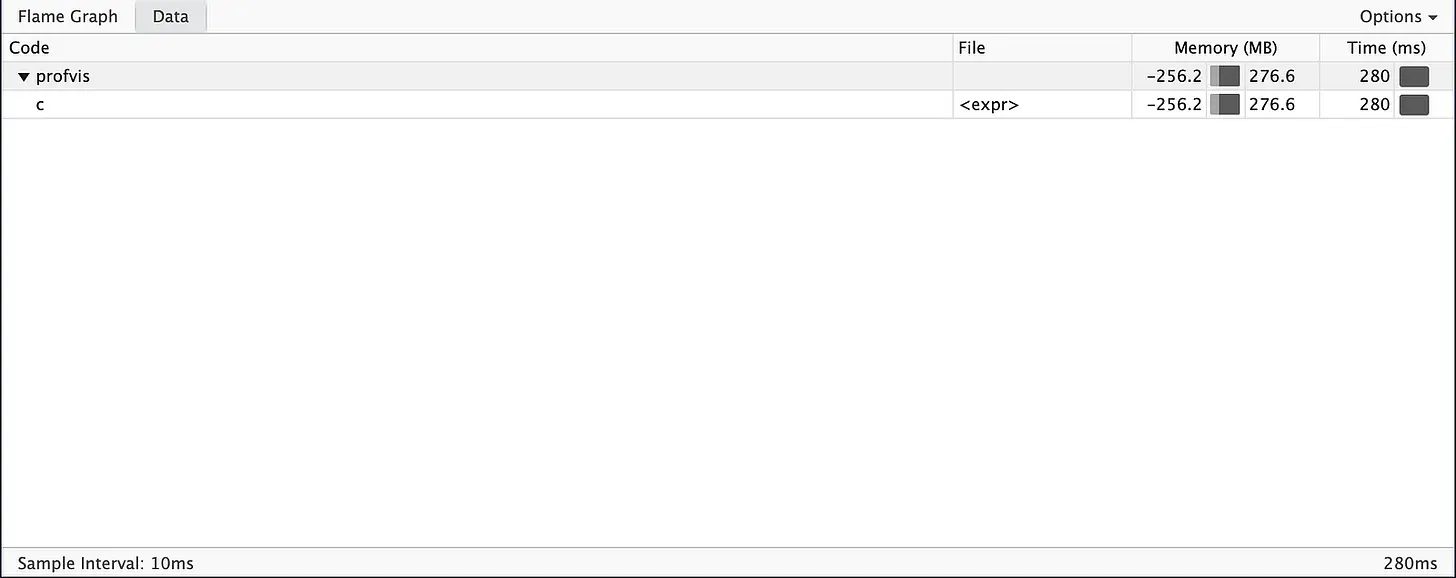
You can also use the ***Data tab***. The ***Data tab*** gives you a compact overview of all calls and is particularly suitable for complex nested calls.
If you want to learn more about provis, you can visit the [Github](https://github.com/rstudio/profvis){:target="_blank" rel="noopener"} page.
## Vectorize your code
Maybe you have heard of vectorization. But what is that? Vectorization is not just about avoiding `for()` loops. It goes one step further. You have to think in terms of vectors instead of scalars. Vectorization is very important to speed up R code. Vectorized functions use loops written in C instead of R.
Loops in C have less overhead, which makes them much faster. Vectorization means finding the existing R function implemented in C that closely matches your task. The functions `rowSums()`, `colSums()`, `rowMeans()` and `colMeans()` are handy to speed up your R code. These vectorized matrix functions are always faster than the `apply()` function.
To measure the runtime, we use the R package [microbenchmark](https://cran.r-project.org/web/packages/microbenchmark/microbenchmark.pdf){:target="_blank" rel="noopener"}. In this package, the evaluations of all expressions are done in C to minimize the overhead. As an output, the package provides an overview of statistical indicators. You can install the microbenchmark package via the R Console with the following command:
```r
install.packages("microbenchmark")
```
Now, we compare the runtime of the `apply()` function with the `colMeans()` function. The following code example demonstrates it.
```r
install.packages("microbenchmark")
library("microbenchmark")
data.frame <- data.frame (a = 1:10000, b = rnorm(10000))
microbenchmark(times=100, unit="ms", apply(data.frame, 2, mean), colMeans(data.frame))
# example console output:
# Unit: milliseconds
# expr min lq mean median uq max neval
# apply(data.frame, 2, mean) 0.439540 0.5171600 0.5695391 0.5310695 0.6166295 0.884585 100
# colMeans(data.frame) 0.183741 0.1898915 0.2045514 0.1948790 0.2117390 0.287782 100
```
In both cases, we calculate the mean value of each column of a data frame. To ensure the reliability of the result, we make 100 runs (`times=10`) using the microbenchmark package. As a result, we see that the `colMeans()` function is about three times faster.
We recommend the online book [R Advanced](https://adv-r.hadley.nz/perf-improve.html){:target="_blank" rel="noopener"} if you want to learn more about vectorization.
## Matrices vs. Data frames
Matrices have some similarities with data frames. A matrix is a two-dimensional object. In addition, some functions work in the same way. A difference: All elements of a matrix must have the same type.
Matrices are often used for statistical calculations. For example, the function lm() converts the input data internally into a matrix. Then the results are calculated. In general, matrices are faster than data frames. Now, we look at the runtime differences between matrices and data frames.
```r
library("microbenchmark")
matrix = matrix (c(1, 2, 3, 4), nrow = 2, ncol = 2, byrow = 1)
data.frame <- data.frame (a = c(1, 3), b = c(2, 4))
microbenchmark(times=100, unit="ms", matrix[1,], data.frame[1,])
# example console output:
# Unit: milliseconds
# expr min lq mean median uq max neval
# matrix[1, ] 0.000499 0.0005750 0.00123873 0.0009255 0.001029 0.019359 100
# data.frame[1, ] 0.028408 0.0299015 0.03756505 0.0308530 0.032050 0.220701 100
```
We perform 100 runs using the microbenchmark package to obtain a meaningful statistical evaluation. It is recognizable that the matrix access to the first row is about 30 times faster than for the data frame. **That’s impressive!** A matrix is significantly quicker, so you should prefer it to a data frame.
## is.na() and anyNA
You probably know the function `is.na()` to check whether a vector contains missing values. There is also the function `anyNA()` to check if a vector has any missing values. Now we test which function has a faster runtime.
```r
library("microbenchmark")
x <- c(1, 2, NA, 4, 5, 6, 7)
microbenchmark(times=100, unit="ms", anyNA(x), any(is.na(x)))
# example console output:
# Unit: milliseconds
# expr min lq mean median uq max neval
# anyNA(x) 0.000145 0.000149 0.00017247 0.000155 0.000182 0.000895 100
# any(is.na(x)) 0.000349 0.000362 0.00063562 0.000386 0.000393 0.022684 100
```
The evaluation shows that `anyNA()` is on average, significantly faster than `is.na()`. You should use `anyNA()` if possible.
## if() … else() vs. ifelse()
`if() ... else()` is the standard control flow function and `ifelse()` is more user-friendly.
`Ifelse()` works according to the following scheme:
```r
# test: condition, if_yes: condition true, if_no: condition false
ifelse(test, if_yes, if_no)
```
From the point of view of many programmers, `ifelse()` is more understandable than the multiline alternative. The disadvantage is that `ifelse()` is not as computationally efficient. The following benchmark illustrates that `if() ... else()` runs more than 20 times faster.
```r
library("microbenchmark")
if.func <- function(x){
for (i in 1:1000) {
if (x < 0) {
"negative"
} else {
"positive"
}
}
}
ifelse.func <- function(x){
for (i in 1:1000) {
ifelse(x < 0, "negative", "positive")
}
}
microbenchmark(times=100, unit="ms", if.func(7), ifelse.func(7))
# example console output:
# Unit: milliseconds
# expr min lq mean median uq max neval
# if.func(7) 0.020694 0.020992 0.05181552 0.021463 0.0218635 3.000396 100
# ifelse.func(7) 1.040493 1.080493 1.27615668 1.163353 1.2308815 7.754153 100
```
You should avoid using `ifelse()` in complex loops, as it slows down your program considerably.
## Parallel Computing
Most computers have several processor cores, allowing parallel tasks to be processed. This concept is called parallel computing. The R package [parallel](https://stat.ethz.ch/R-manual/R-devel/library/parallel/doc/parallel.pdf){:target="_blank" rel="noopener"} enables parallel computing in R applications. The package is pre-installed with base R. With the following commands, you can load the package and see how many cores your computer has:
```r
library("parallel")
no_of_cores = detectCores()
print(no_of_cores)
# example console output:
# [1] 8
```
Parallel data processing is ideal for Monte Carlo simulations. Each core independently simulates a realization of the model. In the end, the results are summarised. The following example is based on the online book [Efficient R Programming](https://csgillespie.github.io/efficientR/performance.html#performance-parallel){:target="_blank" rel="noopener"}.
First, we need to install the [devtools](https://cran.r-project.org/web/packages/devtools/index.html){:target="_blank" rel="noopener"} package. With the help of this package, we can download the [efficient](https://github.com/csgillespie/efficient){:target="_blank" rel="noopener"} package from GitHub. You must enter the following commands in the RStudio console:
```r
install.packages("devtools")
library("devtools")
devtools::install_github("csgillespie/efficient", args = "--with-keep.source")
```
In the efficient package, there is a function `snakes_ladders()` that simulates a single game of Snakes and Ladders. We will use the simulation to measure the runtime of the `sapply()` and `parSapply()` functions. `parSapply()` is the parallelised variant of `sapply()`.
```r
library("parallel")
library("microbenchmark")
library("efficient")
N = 10^4
cl = makeCluster(4)
microbenchmark(times=100, unit="ms", sapply(1:N, snakes_ladders), parSapply(cl, 1:N, snakes_ladders))
stopCluster(cl)
# example console output:
# Unit: milliseconds
# expr min lq mean median uq max neval
# sapply(1:N, snakes_ladders) 3610.745 3794.694 4093.691 3957.686 4253.681 6405.910 100
# parSapply(cl, 1:N, snakes_ladders) 923.875 1028.075 1149.346 1096.950 1240.657 2140.989 100
```
The evaluation shows that `parSapply()` the simulation calculates on average about 3.5 x faster than the `sapply()`function. **Wow!** You can quickly integrate this tip into your existing R project.
## R interface to other languages
There are cases where R is simply slow. You use all kinds of tricks, but your R code is still too slow. In this case, you should consider rewriting your code in another programming language. For other languages, there are interfaces in R in the form of R packages. Examples are [Rcpp](https://cran.r-project.org/web/packages/Rcpp/index.html){:target="_blank" rel="noopener"} and [rJava](https://cran.r-project.org/web/packages/rJava/index.html){:target="_blank" rel="noopener"}. It is easy to write C++ code, especially if you have a software engineering background. Then you can use it in R.
First, you have to install Rcpp with the following command:
```r
install.packages("Rcpp")
```
The following example demonstrates the approach:
```r
library("Rcpp")
cppFunction('
double sub_cpp(double x, double y) {
double value = x - y;
return value;
}
')
result <- sub_cpp(142.7, 42.7)
print(result)
# console output:
# [1] 100
```
C++ is a powerful programming language, which makes it best suited for code acceleration. For very complex calculations, we recommend using C++ code.
## Conclusion
In this article, we learned how to analyse R code. The provis package supports you in the analysis of your R code. You can use vectorised functions like `rowSums()`, `colSums()`, `rowMeans()` and `colMeans()` to accelerate your program. In addition, you should prefer matrices instead of data frames if possible. Use `anyNA()` instead of `is.na()` to check if a vector has any missing values. You speed up your R code by using `if() ... else()` instead of `ifelse()`. Furthermore, you can use parallelised functions from the parallel package for complex simulations. You can achieve maximum performance for complex code sections by using the Rcpp package.
There are some books for learning R. You find three books that we think are very good for learning efficient R programming in the following:
* Efficient R Programming: A Practical Guide to Smarter Programming
* Hands-On Programming with R: Write Your Own Functions and Simulations
* R for Data Science: Import, Tidy, Transform, Visualize, and Model Data
Thanks so much for reading. **Have a great day!**
💡 Do you enjoy our content and want to read super-detailed guides about AI Engineering? If so, be sure to check out our premium offer!