**Plotly Dash is an open-source framework for building interactive web-based analytical applications.**
Generated with Grok
With Dash, you can easily create web apps in pure Python, without JavaScript knowledge. We will introduce you to the basic concepts of Dash and show you how to set up a web app in a few minutes. We create a simple stock dashboard.
The steps are the following:
1. **Technical requirements**
2. **What is Plotly Dash?**
3. **Build your first Dash application**
4. **Conclusion**
## Technical requirements
You will need the following prerequisites:
* Python package manager of your choice like [conda](https://docs.conda.io/en/latest/miniconda.html){:target="_blank" rel="noopener"}.
* A code editor of your choice like [Visual Studio Code](https://code.visualstudio.com/){:target="_blank" rel="noopener"}.
## What is Plotly Dash?
Dash is written on top of Plotly.js and React.js. The open-source library is licensed under the permissive MIT license. You can use Dash to build and deploy web apps with customised User Interface (UI) in Python, R, Julia, and F#. Dash abstracts the protocols and technologies needed to create a full-stack web app.
This approach allows you to create web apps in minutes. Plotly has its Medium blog, which we highly recommend. In the blog article [“Dash is React for Python, R, and Julia”](https://medium.com/plotly/dash-is-react-for-python-r-and-julia-c75822d1cc24){:target="_blank" rel="noopener"}, the Plotly team illustrates the power of Dash. The following quote from the article sums up the advantage of Dash for Data Scientists.
> Dash makes the richness and innovation of the React frontend ecosystem available to Python, R, and Julia engineers for the first time.
The Dash Framework also allows Data Scientists or Statisticians to create an interactive data app. With Dash, you can present your data analyses interactively. An interactive demo is always well-received by the audience.
## Build you first Dash application
Let’s start with the practical part! First, you must create a folder called **app**. We put all our files in this folder.
### Create a conda environment
You create a virtual environment to keep your main system clean.
```bash
conda create -n dash-app python=3.9.12
conda activate dash-app
```
### Install requirements
Now, you must create the following requirements.txt file in the **app** folder. This file contains all necessary dependencies.
**requirements.txt**
```
dash==2.9.1
dash-bootstrap-components==1.4.1
yfinance==0.2.14
```
The requirements.txt includes the following Python packages:
* **dash:** This Python package contains Dash Framework.
* **dash-bootstrap-components:** This Python package is a library of bootstrap components for use with Plotly Dash. This library enables the creation of consistently styled Dash applications with complex responsive layouts.
* **yfinance:** Download market data from Yahoo! Finance’s API.
Next, you can install the requirements with the following command:
```bash
pip install -r requirements.txt
```
This process takes a few seconds.
### Dash Application
Now, we are ready for coding! You can use the example presented here as a template for your first Dash app. If you are creating large web applications, you should not write everything in one file. A structured project structure is essential, so that you can maintain your app in the future.
Our project structure looks as follows:
```
.
├── dash-app # "dash-app" is a Python package
│ ├── assets # this folder contains the favicon and style files
│ ├── components # this folder contains reusable components
│ ├── screens # this folder contains the pages
│ ├── __init__.py # this file makes "app" a "Python package"
│ ├── app.py
│ ├── index.py
│ └── requirements.txt # required Python packages
```
In the following, we present all these files in detail.
**app.py**
```python
import dash
import dash_bootstrap_components as dbc
APP_TITLE = "Plotly Dash"
app = dash.Dash(__name__,
title=APP_TITLE,
update_title='Loading...',
suppress_callback_exceptions=True,
external_stylesheets=[dbc.themes.FLATLY])
```
First, we import the Dash Framework and the Dash Bootstrap components. After that, we save the App title in a variable to use it again in later programme code. In the next step, we create the Dash App with dash.Dash(). We pass some parameters to the function, such as the title and external stylesheet.
**index.py**
```python
"""
This file is the entry point of the app.
Run this app with `python index.py` and
visit http://127.0.0.1:7000/ in your web browser.
"""
from dash import dcc
from dash import html
from dash.dependencies import Input, Output
# import screens
from screens.dashboard import render_dashboard
from screens.page_not_found import page_not_found
from app import app
server = app.server
def serve_content():
"""
:return: html div component
"""
return html.Div([
dcc.Location(id='url', refresh=False),
html.Div(id='page-content')
])
app.layout = serve_content()
@app.callback(Output('page-content', 'children'),
Input('url', 'pathname'))
def display_page(pathname):
"""
:param pathname: path of the actual page
:return: page
"""
print('show page')
if pathname in '/' or pathname in '/dashboard':
return render_dashboard()
return page_not_found()
if __name__ == '__main__':
app.run_server(debug=True, host='127.0.0.1', port=7000)
```
This file contains the entry point of the app. The ```app.run_server()``` line starts the application. With the parameter ```debug=True```, you activate the debug output for development. We also set the ```host``` to ```127.0.0.1``` (localhost) and the ```port``` to ```7000```, so the application is accessible via http://localhost:7000.
In addition, the ```index.py``` file contains the two functions ```serve_content()``` and ```display_page()```. We assign the function ```serve_content()``` to ```app.layout```, so that it is executed when the app is started. The function returns an html div element. The div element contains the components ```dcc.Location()``` and ```html.Div()``` as children. The ```dcc.Location()``` component represents the location in your web browser. For more information, see the Dash [documentation](https://dash.plotly.com/dash-core-components/location).
We use the ```html.Div()``` component for our page content. The function ```display_page()``` is a dash callback. A callback reacts to changes in the ```Input()``` elements. In our case, on changes to the ```dcc.Location()``` component with the ```id='url'```. The function decides via an ```if``` which page the function returns.
With ```Output()```, you define to which element the return is passed. In our case, we assign the page to the ```html.div()``` component with the ```id='page-content'``` as a child. So when you start the app, the Dashboard page appears. All right, now let’s look at the structure of the dashboard page in detail.
**screens/dashboard.py**
```python
import yfinance as yf
import dash_bootstrap_components as dbc
from dash import html
from dash.dependencies import Input, Output
# import components
from components.dropdown import render_dropdown
from components.navbar import navbar
from components.visualisation import *
from app import app
def render_dashboard():
"""
:return: html.Div with dashboard content
"""
return html.Div([
navbar,
html.Div(
[
html.Br(),
dbc.Container(
fluid=True,
children=[
dbc.Row(
[
dbc.Col(
width=2,
children=dbc.Card(
[
dbc.CardHeader("Stocks"),
dbc.CardBody(
[
render_dropdown(dropdown_id="dropdown-choose-stock", items=['TSLA', 'AAPL', 'SQ', 'PLTR'])
]
)
],
style={'height': "84vh"},
)
),
dbc.Col(
width=10,
children=dbc.Card(
[
dbc.CardHeader("Visualisation"),
dbc.CardBody(
[
render_dropdown(dropdown_id='dropdown-vis', items=['Line Plot']),
html.Div(id='div-vis')
]
)
],
style={'height': '84vh'}
)
)
]
)
]
),
]
)
])
@app.callback(
Output(component_id='div-vis', component_property='children'),
Input(component_id='dropdown-choose-stock', component_property='value')
)
def update_vis(stock):
df = yf.download(tickers=stock, period='1d', interval='1m')
fig = line_plot(df, stock)
return fig
```
First, we import a few necessary packages and functions. The file ```dashboard.py``` contains the function ```render_dashboard()```, which we have already called in ```index.py```. In this function, we implement the functionality of our dashboard page. For this, we use the [Dash Bootstrap Components](https://dash-bootstrap-components.opensource.faculty.ai/docs/components/) and the [Dash Core Components](https://dash.plotly.com/dash-core-components).
The dashboard consists of a navigation bar ```navbar``` and an ```html.Div()``` with the dashboard components. The structure of the navbar is explained further below. The file also contains a callback to update the line chart. We obtain the data via the yfinance API.
**screens/page_not_found.py**
```python
from dash import html
def page_not_found():
"""
:return: html div element
"""
return html.Div([
html.H1('404'),
html.H2('Page not found'),
html.H2('Oh, something went wrong!')
])
```
The page ‘Page not found’ is always displayed when a page is not found. For example, if you enter an incorrect path in the URL.
**components/dropdown.py**
```python
from dash import dcc
def render_dropdown(dropdown_id: str, items=[''], clearable_option=False):
"""
This function can be used to render a dropdown menu.
:param clearable_option: option to clear dropdown menu
:param items: list of items
:param dropdown_id: id of the dropdown menu
:return: dropdown html component
"""
dropdown = dcc.Dropdown(
id=dropdown_id,
clearable=clearable_option,
options=[{'label': i, 'value': i} for i in items],
value=items[0],
)
return dropdown
```
The ```dropdown.py``` file encapsulates the settings and structure of the dropdown menu. This procedure has the advantage that you can define the style of your dropdown menus in this file.
**components/navbar.py**
```python
import dash_bootstrap_components as dbc
# import own style (see /assets)
from assets.style import MAIN_COLORS
navbar = dbc.NavbarSimple(
children=[
dbc.NavItem(dbc.NavLink("Dashboard", href="/dashboard")),
],
brand="Stock Dashboard",
brand_href="/",
color=MAIN_COLORS["primary"],
sticky='top',
links_left=True,
dark=True
)
```
For the navigation bar, we use [NavbarSimple](https://dash-bootstrap-components.opensource.faculty.ai/docs/components/navbar/){:target="_blank" rel="noopener"} from the Dash Bootstrap components. You can design the navbar according to your wishes.
**components/visualisation.py**
```python
from dash import dcc
import plotly.express as px
def line_plot(df, stock:str):
"""
Plot line chart.
:param df: dataframe with the data
:param stock: ticker name
:return: dcc.Graph
"""
fig = px.line(df, x=df.index, y=df['Adj Close'])
fig.update_layout(title=str(stock))
return dcc.Graph(figure=fig)
```
In the ```visualisation.py``` file, we define our plots. In our simple example, we have implemented a line chart with [Plotly Express](https://plotly.com/python/plotly-express/){:target="_blank" rel="noopener"}.
**assets/style.py**
```python
MAIN_COLORS = {
'primary': '#165AA7',
'secondary': '##000000',
'third': '#FFFFFF',
}
```
The ```style.py``` file contains all the style information for your app. In our case, we have stored our colour scheme here.
**assets/typography.css**
```css
body {
font-family: sans-serif;
}
h1, h2, h3, h4, h5, h6 {
text-align: center;
}
```
In the file ```typography.css``` you can define the typography css stuff.
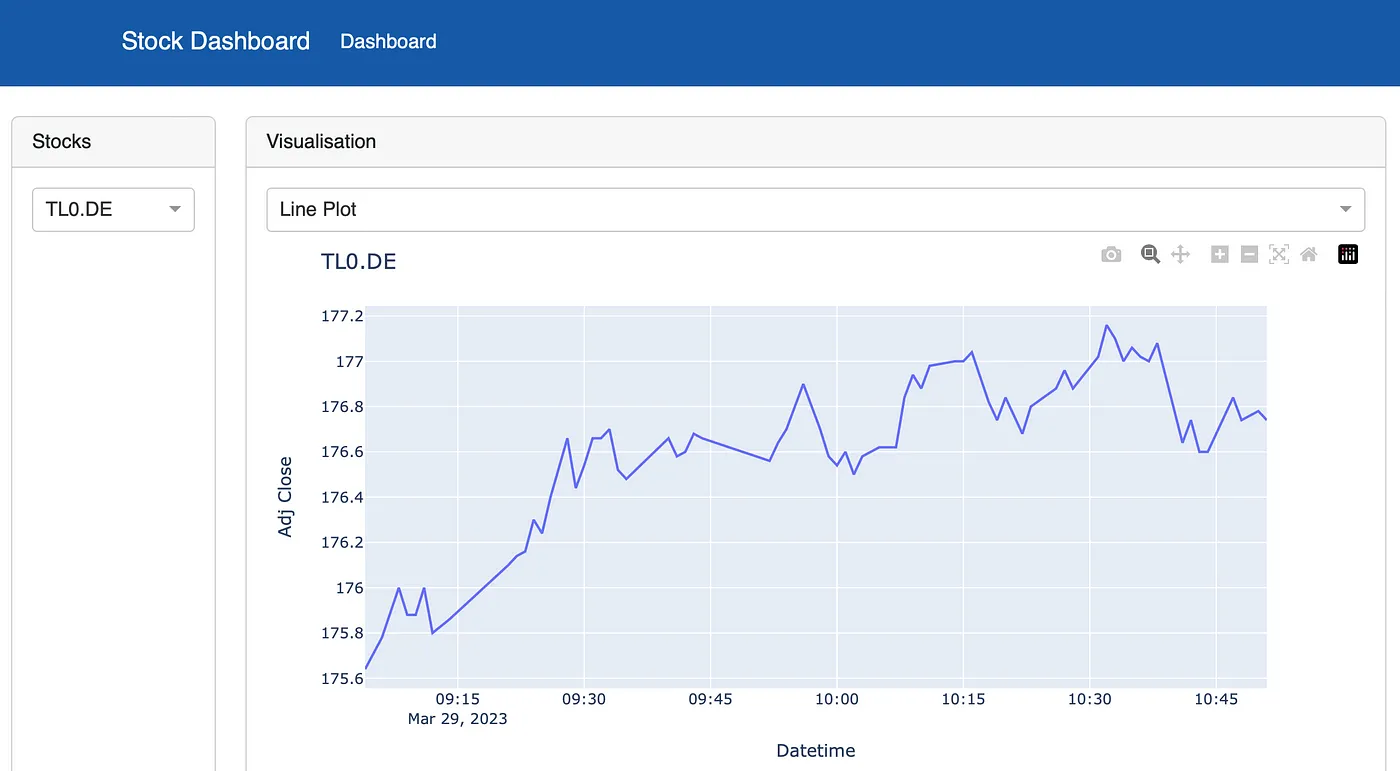
Now you have everything to start the app. You can start it with ```python index.py```. Open your web browser at http://127.0.0.1:7000. You see the following dashboard.
Stock Dashboard (Screenshot by authors)
Congrats! You have built your first Dash App. 😎😎
## Conclusion
In this article, we show you how you can implement a simple Dash application. We have presented you a project structure so that you can implement maintainable Dash applications. Feel free to use this app as a starting point for your first Dash app.
💡 Do you enjoy our content and want to read super-detailed guides about AI Engineering? If so, be sure to check out our premium offer!